Failure detection
Connection errors, HTTP errors, and the 200 OK with an error in the body that only your callback can spot.
Every recorded call is either a success or one of three failure types. They are stored separately because they mean different things: a connection error is usually the network or the vendor being down, an HTTP error is the vendor refusing the request, and an application error is the vendor answering normally while telling you it did not work.
| failure_type | When | Status | Message |
|---|---|---|---|
connection_error |
No response arrived at all | none | The cause, where cURL reports one: Timed out, DNS resolution failed |
http_error |
A response with status 400 or above | the status | HTTP 503 Service Unavailable |
application_error |
A response below 400 that your detector flagged | the status, usually 200 | Whatever your detector returned |
They are checked in that order, and the first that applies wins. A failed call also stores its response body (see below). A successful call stores none.
Connection errors#
A transfer that never produced a response still reaches Guzzle's on_stats hook, with cURL's error
number attached. Requizon turns the common ones into a readable cause, which is what lets the failures list tell a
DNS problem from an expired certificate from a vendor that simply stopped answering:
| cURL error | Recorded as |
|---|---|
| 5, 6 | DNS resolution failed (proxy), DNS resolution failed |
| 7 | Connection refused |
| 28 | Timed out |
| 35 | TLS handshake failed |
| 51, 58, 60, 83 | A TLS certificate problem, named by kind |
| 52 | Empty response from server |
| 55, 56 | Network send error, Network receive error |
Any other number is recorded as cURL error N. A timeout's duration is the time until cURL gave up, which
is roughly your client's timeout(). On a chart of response times that shows up as a spike, and it is
real: that is how long your code waited.
200 OK, with the error in the body#
Plenty of APIs answer 200 OK and put the failure in the payload. Recorded by status alone, those calls
count as successes, and a dashboard showing 100% success for an integration that is failing is worse than no
dashboard. Register one detector, in the boot() method of your RequizonServiceProvider, that
knows what failure looks like for each API:
use BoringO11y\Requizon\Requizon;

public function boot(): void
{
    parent::boot();

    Requizon::detectFailuresUsing(function ($body, $response, $request) {
        return match ($request->getUri()->getHost()) {
            'ws.nausys.com' => is_array($body) && ! empty($body['errorCode'])
                ? trim("error {$body['errorCode']} ".($body['errorMessage'] ?? ''))
                : null,
            'maps.googleapis.com' => is_array($body) && ! in_array($body['status'] ?? 'OK', ['OK', 'ZERO_RESULTS'], true)
                ? $body['status']
                : null,
            'soap.example.com' => is_string($body) && str_contains($body, '<soap:Fault>')
                ? 'SOAP fault'
                : null,
            default => null,
        };
    });
}
It is called with three arguments:
-
$body: the decoded array when the response'sContent-Typecontainsjsonand the body decodes to an array, and the raw string otherwise $response: the PSR-7 response, for headers and the status code$request: the PSR-7 request, for the host, path and method
Return a non-empty string to record the call as an application_error with that string as its message.
Return null (or an empty string) to record it as a success. Keep messages short and stable, like an error
code: the failures list is easier to scan when the same failure always reads the same way.
What registering a detector costs#
With a detector registered, Requizon reads the body of every response that was not already a failure, so it can pass it in. Without one, it never reads a successful body. The read is bounded and put back:
-
At most
recording.response_body_max_bytes(64 KB) is read. A larger JSON response arrives cut off, fails to decode, and is passed as a string, so a detector for an API with large payloads should checkis_array($body)before indexing into it, as above. - The stream is rewound afterwards, so
$response->json()in your own code still sees the whole body. -
A body that cannot be rewound is not read at all. A request made with
stream => truegives exactly that, a stream over the remote resource, and reading it would hand your code an empty download. Streamed responses are recorded, but without failure detection.
The detector runs inside recording, and recording never lets an exception reach your call. If the detector throws
(an undefined index on an unexpected payload is the usual one), the exception is reported to your exception
handler and that call is not recorded at all. Write it defensively, and return null for anything it
does not recognise.
The stored response body#
Every failed call stores its response body in http_requests.response_body, up to
recording.response_body_max_bytes. Anything longer is cut and ends in …[truncated]. The
requests list shows it under Details, next to the failure message and the request parameters, so you
debug against what the API actually sent at the moment it failed.
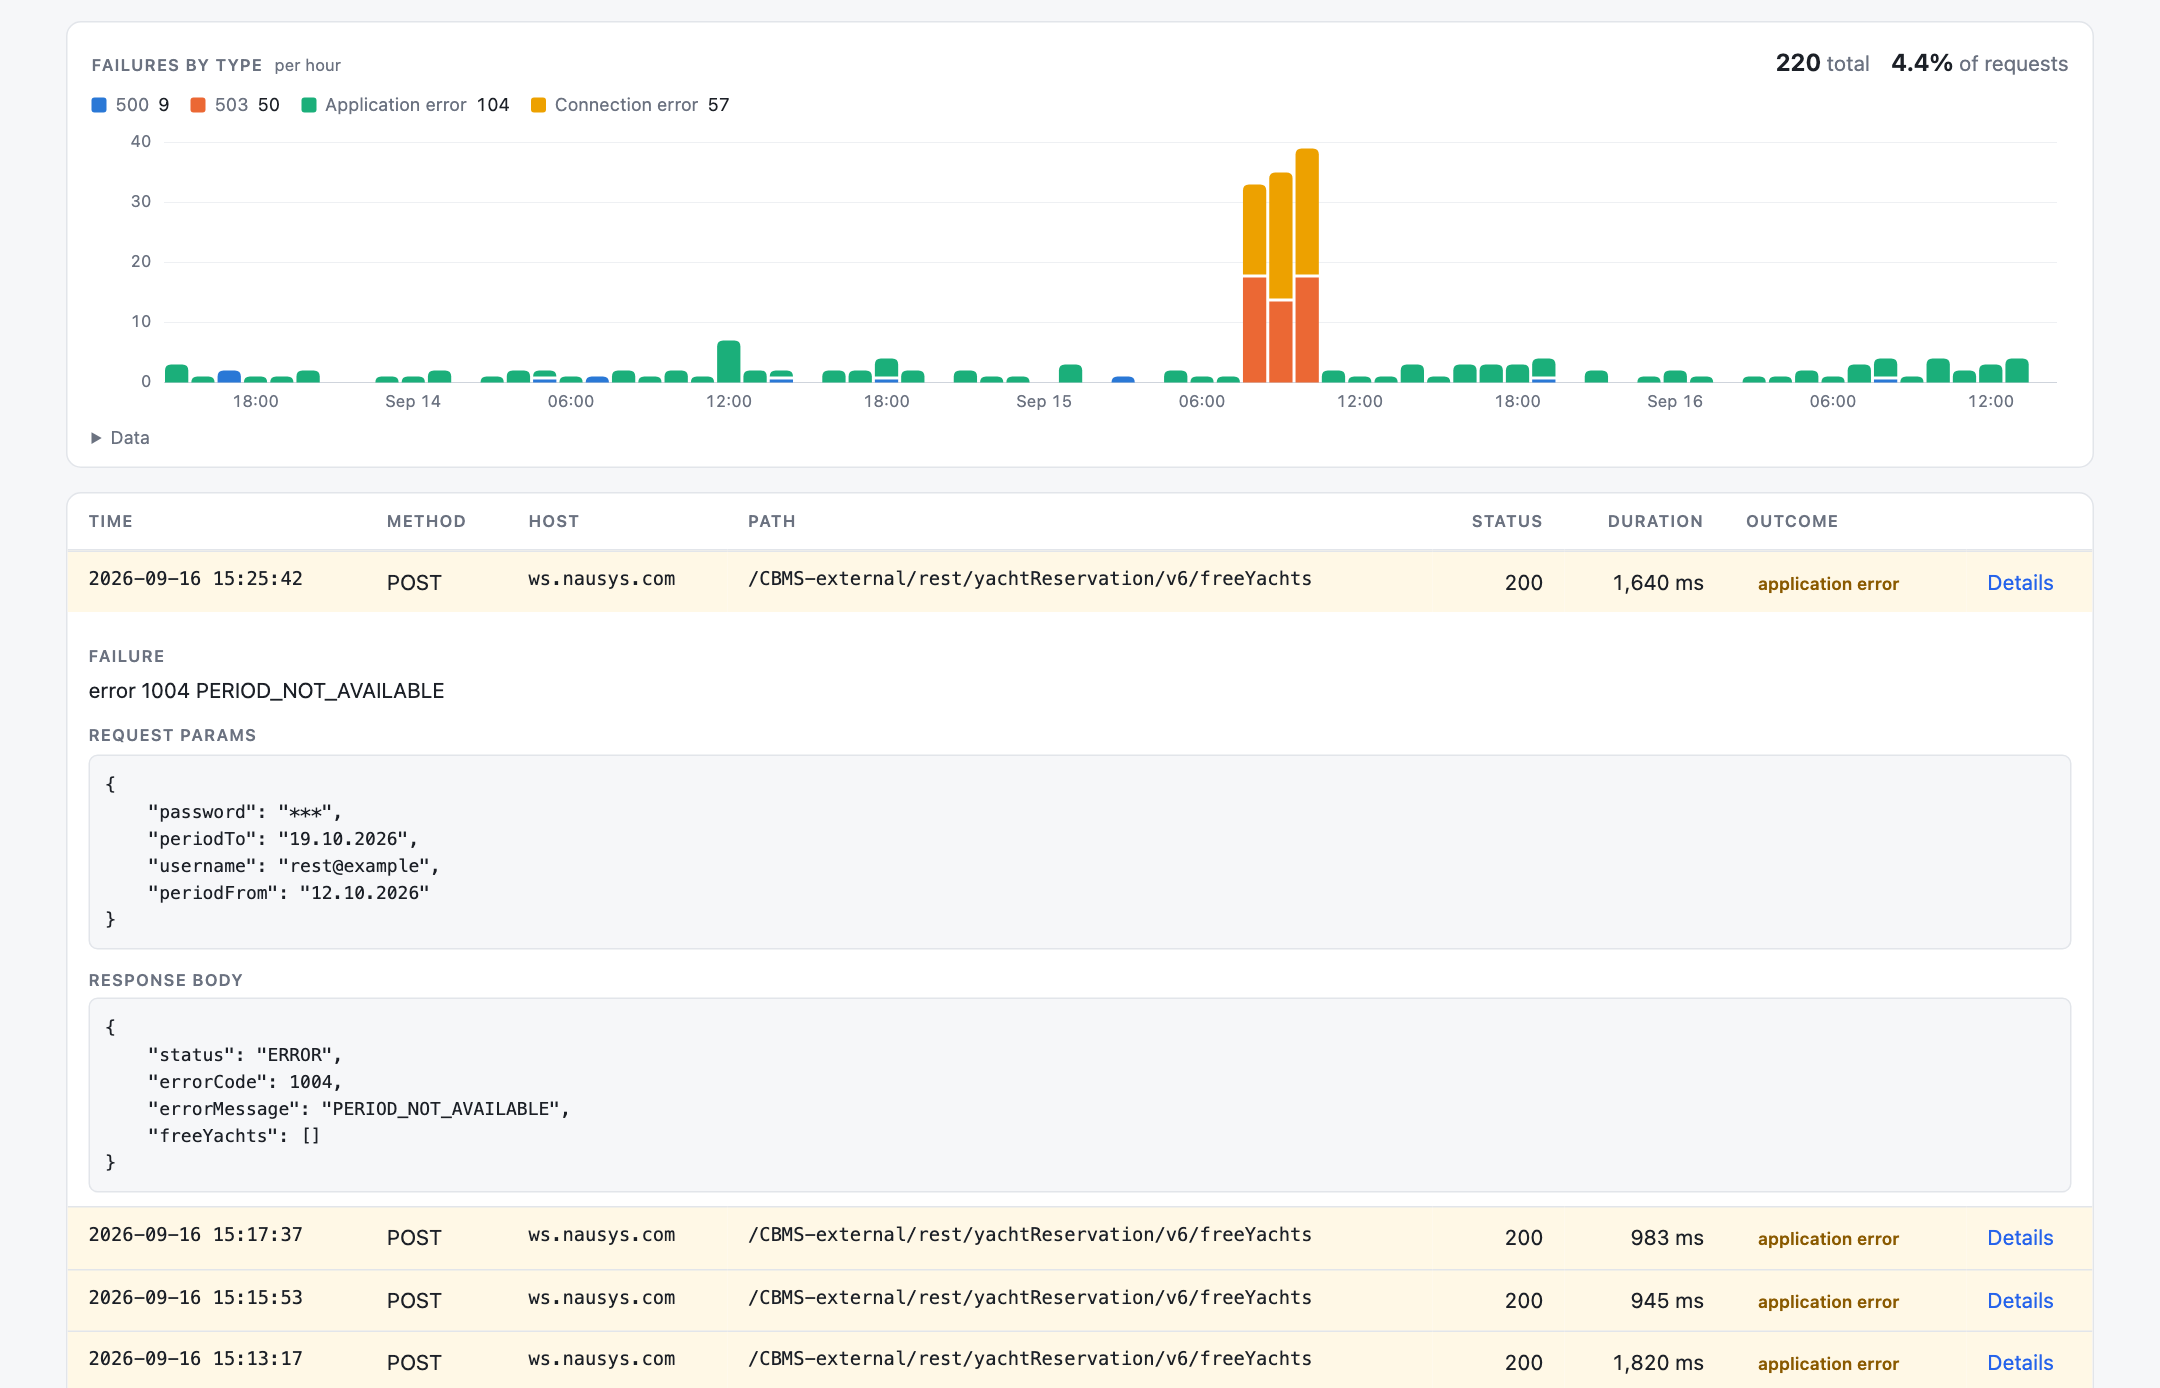
The body is stored without redaction. Redaction and stored data explains why, and what that means for how long you keep it. A connection error has no body to store.
Finding failures on the dashboard#
An API's requests page has a Failures link, and its filter narrows the list to one failure type or
one status code. The responses chart follows the filter, so filtering to connection_error charts only
connection errors per hour, and an outage stands out rather than sitting on top of thousands of successes. See
The dashboard.